In a normal year one would expect April to be the turning point for
the LA real estate market. March is still cold and the children are
still in school for another 10 weeks. April’s the month when the
weather turns warm, the flower buds poke up, and the buyers come out to
start the spring buying season. It hasn’t happened that way this year.
Prices had gone through the ceiling by the end of 2021, much of the
activity stimulated by fear of escalating mortgage interest rates. Usher
in 2022–January and February were typically slow and in March home
sales bounced up like an indicator of business as usual. But, interest
rates continued to climb and April ended with the total number of home
sales down instead of up. Likewise, total sales dollars were down across
the South Bay.
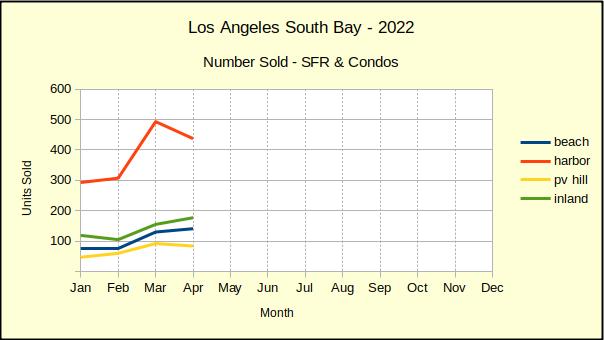
Number of Homes Sold
Judging from the charts, entry level homes in the Harbor area were
clearly the center of activity for South Bay real estate. As interest
rates pushed against the 5% mark, panic set in among first time buyers
who had been outbid multiple times. Prices went up as high as buyers
could afford, a number that shrinks amazingly fast with each tenth of a
percent increase in the interest rate.
Across the South Bay, the number of homes sold in April dropped by
-4% from March, which had been an increase of 59% over the prior month.
As we see from the chart below, sales were uneven between the various
areas.
On the entry level front, at the same time Harbor area home sales
were dropping off, Inland homes gained sales. On the high end, sales on
the Palos Verdes peninsula were also facing declining numbers, while
Beach area sales increased.
So far declining sales counts have been modest, but a decline
overall, coupled with a decline in half of the individual areas covered
indicates that buyers are pulling back. Part of the resistance is a
matter of simply being priced out of the market. Another important piece
is the anticipation of price corrections in the near future. We have
heard multiple buyers say they are watching and waiting for lower prices
later this year.
At this point we’re well into the second quarter of the year and it
looks as though those folks may be on track for some savings. even some
of our most gung-ho pundits are beginning to see a market downturn on
the horizon.
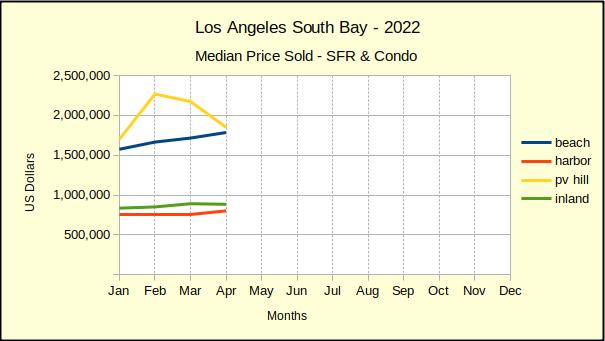
Median Price Sold
Interestingly, Harbor area prices went up at the same time the number
of sales went down.The March to April price increase was a modest +6%
compared to a +21% increase over April of last year. Similarly, the
Beach cities had a month over month increase of +4%, while showing +19%
year over year. While sales prices are still rising in those areas, the
increase is a fraction of what it was last year.
Sold prices on the Hill continued to slide downwards. Because the
February increase in the median price was created by the sale of new
construction, and that building phase is now sold out, a downward turn
in median price is expected. We anticipate that leveling off soon.
In the Inland area the median price for homes sold during April of
2022, was +12% greater than sales in April of 2021. By comparison, the
median price of those sold in March of 2022 versus April of 2022
decreased by -1%. It’s a modest decrease that points to the direction of
the South Bay real estate market for the balance of the year.
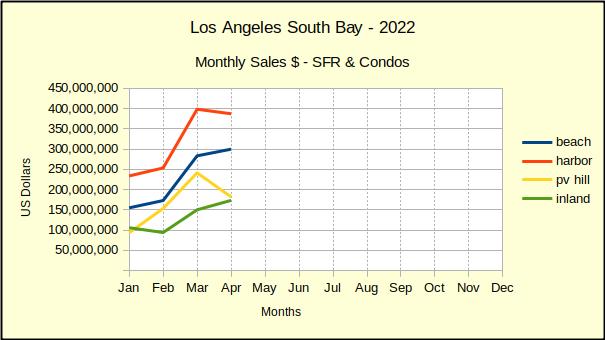
Area Sales Dollars
The total dollar value of home sales in the South Bay usually tracks
right along with the number of units sold. The few times it differs are
important times like these when the number of homes sold is dropping,
and/or the sales prices are dropping. Today, of the four areas we track,
PV Hill has a declining number of sales, both in comparison to last
year and in comparison to last month. As we noted above, the area also
is declining in total dollars compared to last year and last month.
As we discussed in last month’s issue, some of the reason for the
drop is found in new construction homes that sold at a much higher price
than the typical Palos Verdes resale home. The rest of it can be found
in longer days on market waiting for a buyer, and in price reductions.
At the opposite end of the spectrum, the Beach cities showed gains
last month for both number of units sold and for the total sales value
of those homes. The only decline this month for the Beach was in number
sold compared to April of last year. Sales this April were off by -21%.
The Harbor area still trended upward in dollar value, both month over
month and year over year. But, the number of units sold was down for
both time measurements. The price competition was very stiff in what is
generally an entry level market. During the past couple years, bidding
wars and over-asking sales prices have kept the dollars high. The April
numbers show that changing rapidly.
Total dollar sales for the Inland community increased 15% month over
month. That was the highest growth of all four areas. Scanning those
individual transactions showed an odd pattern. Sales in the price range
from about $325K up to about $750K were a familiar mix of some under
asking price, some at asking and some above asking. The degree of
variance was about what one would expect. Unexpectedly, for sales over
$750K, nearly every property sold above asking price, and in many cases well above asking.
We found no clear explanation for why this phenomena occurred. There
is a suspicion that buyers who were priced out of Beach properties may
have shifted their bidding wars into the increasingly popular parts of
west Torrance. This theory is supported by the distribution of sales
among the various neighborhoods.
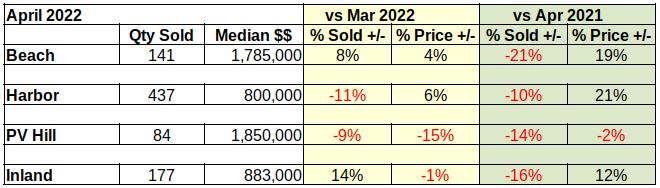
In Summary
In the table below are the core statistics comparing April to March
of this year, and comparing April of this year to April of 2021. The
prevalence of negative numbers is convincing evidence that high prices
and high interest rates are pushing the South Bay real estate market
into a recession.
Notable Properties
One of the more interesting properties sold in April is a four
bedroom, five bathroom home located in west Torrance. The home was
purchased by the seller as their family home in 1990 for just above
$360K. The children grew up and the parents remodeled in 2022 and sold
the house.
As would be expected in a good neighborhood with a contemporary
remodel, the home sold for over the asking price of $2.7M. The final
selling price was slightly over $3M. and just happened to be almost
exactly $360K over the asking price.
In the 32 years that family owned the home it appreciated at an
average rate in excess of $84K per year. It’s the classic “American
Dream.”
Main photo by Amy Vosters on Unsplash